NAPLAN – National Assessment Program Literacy and Numeracy Update
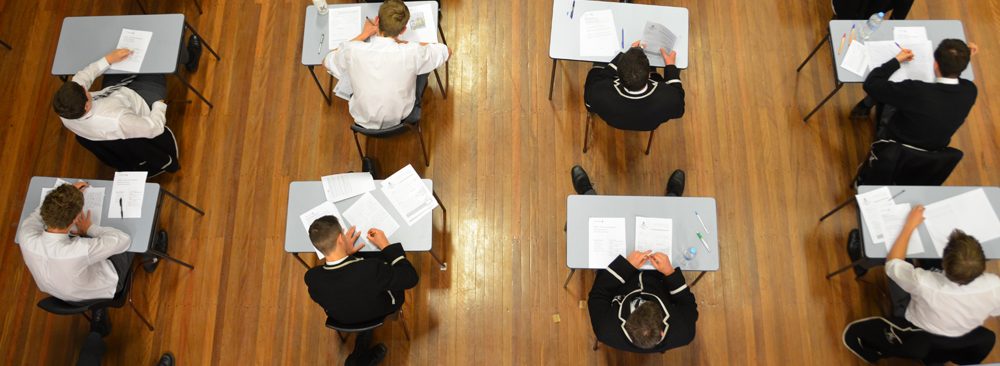
In May 2013, as part of the National Assessment Program – Literacy and Numeracy (NAPLAN), national tests were held in literacy and numeracy for all students in Australia at Years 3, 5, 7 and 9.
In Years 7 and 9, Literacy was assessed via a 45 minute test on Language Conventions (comprising spelling, grammar and punctuation), a 40 minute test on Writing and a 65 minute test on Reading. Numeracy was assessed via an 80 minute test comprising Number, Algebra, Functions and Patterns, Space, Measurement and Chance and Data. The test was broken into two 40 minute sessions. Students were not able to use calculators in the first session but they were allowed the use of a calculator in the second session.
On advice from ACARA, it is anticipated that the 2013 student reports will be delivered to schools between 8 – 11 October with distribution of reports to parents to occur in the week beginning Monday 14 October. The distribution of reports is much later than anticipated due to an administrative issue that occurred with the Year 5 and Year 7 reports in the Language Conventions component of the testing. We will, of course, distribute the reports to parents as soon as ACARA makes them available. In the meantime we have been provided with a summary of the College’s results.
Results are reported in Band Levels – Band 10 is the highest possible band for students in Year 9 and Band 9 is the highest level for students in Year 7. The percentage of Newington boys achieving results in the top bands is indicated in the tables below. State percentages have been stated to allow you to make a comparison with the school cohort.
Aspects of Literacy – Year 9
| Reading | Writing | Spelling | Grammar and Punctuation | ||
| Band 10 | Newington | 15.9 | 27.2 | 22.3 | 22.3 |
| State | 5.9 | 7.9 | 9.8 | 10.3 | |
| Band 9 | Newington | 38.1 | 21.8 | 28.2 | 19.3 |
| State | 18.9 | 10.7 | 14.8 | 12.3 |
Aspects of Literacy – Year 7
| Reading | Writing | Spelling | Grammar and Punctuation | ||
| Band 9 | Newington | 27.9 | 13.4 | 26.3 | 31.8 |
| State | 11.4 | 6.0 | 13.1 | 15.1 | |
| Band 8 | Newington | 30.7 | 21.8 | 28.2 | 19.3 |
| State | 20.1 | 14.8 | 24.4 | 19.4 |
Aspects of Numeracy – Year 9
|
Number, Patterns & Algebra |
Measurement, Data, Space & Geometry |
Numeracy | ||
| Band 10 | Newington | 48.0 | 45.5 | 48.5 |
| State | 16.6 | 15.5 | 16.3 | |
| Band 9 | Newington | 23.8 | 22.3 | 20.8 |
| State | 13.0 | 13.6 | 13.6 |
Aspects of Numeracy – Year 7
|
Number, Patterns & Algebra |
Measurement, Data, Space & Geometry |
Numeracy | ||
| Band 10 | Newington | 33.8 | 39.8 | 34.7 |
| State | 14.9 | 16.8 | 14.6 | |
| Band 9 | Newington | 25.0 | 23.6 | 28.2 |
| State | 13.8 | 15.4 | 16.3 |
Whilst comparisons with the state offer a useful insight, comparing the Newington results with those achieved by other boys in the state is perhaps more meaningful.
The following table lists the school mean in comparison to the mean score achieved by all boys across the state:
Year 9
| Section | School Mean | State Mean (Boys) |
| Reading | 634.2 | 580.8 |
| Writing | 631.8 | 533.6 |
| Spelling | 638.9 | 584.3 |
| Grammar & Punctuation | 637.6 | 569.3 |
| Number, Patterns & Algebra | 688.9 | 603.7 |
| Measurement, Data, Space & Geometry | 681.3 | 601.8 |
| Numeracy | 685.4 | 602.8 |
Year 7
| Section | School Mean | State Mean (Boys) |
| Reading | 596.1 | 540.8 |
| Writing | 567.1 | 500.1 |
| Spelling | 591.8 | 551.9 |
| Grammar & Punctuation | 594.3 | 531.9 |
| Number, Patterns & Algebra | 608.1 | 553.5 |
| Measurement, Data, Space & Geometry | 614.3 | 556.0 |
| Numeracy | 611.3 | 555.0 |
Clearly the Newington boys in Years 7 and 9 2013 have very strong literacy and numeracy skills in comparison to their statewide cohort, particularly when compared with their male counterparts. They are to be congratulated on these outstanding results.
Ms Julia Shea
Head of Learning and Teaching


